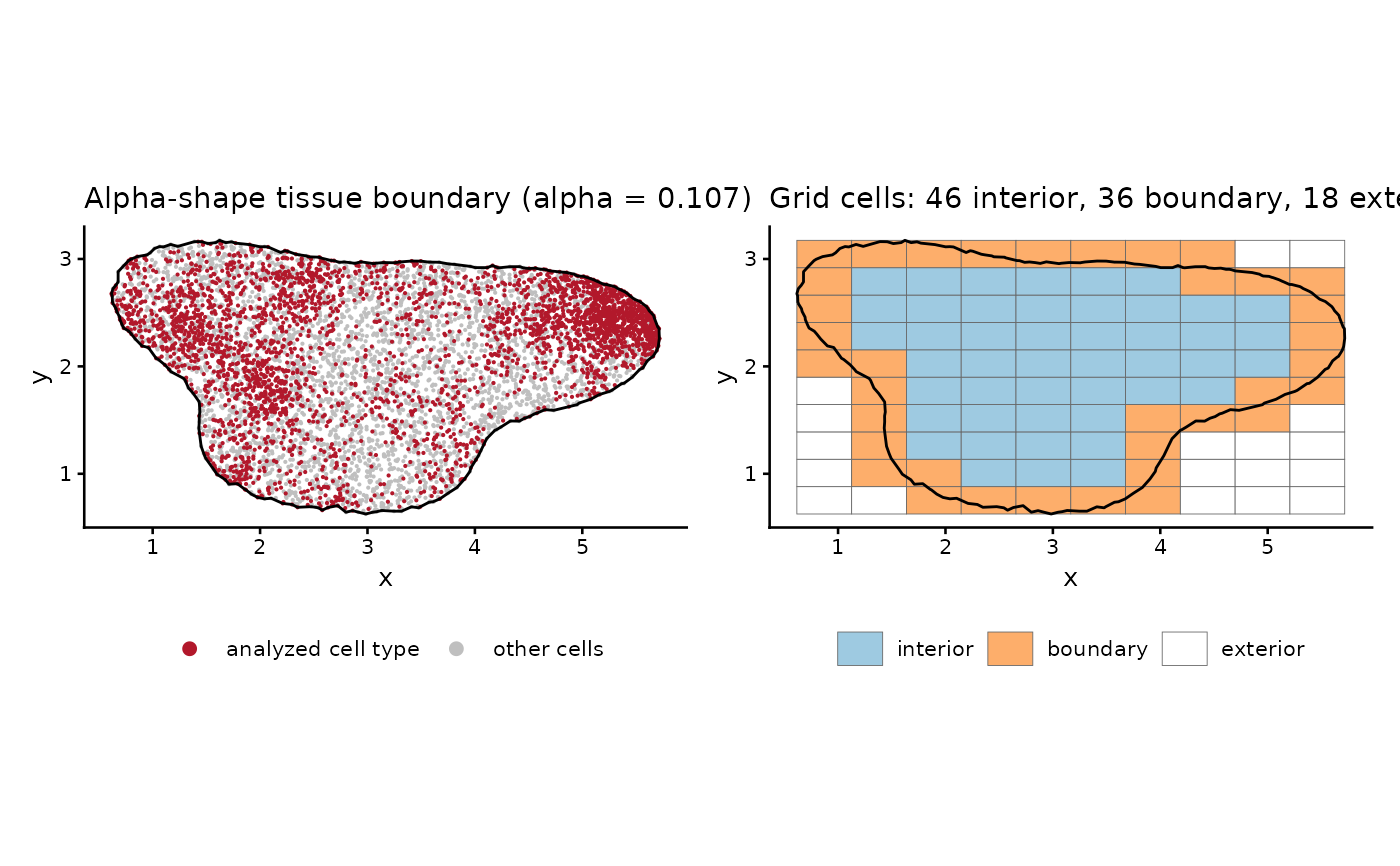
Left: all cells (gray), the cells of the analyzed type (colored) and the
alpha-shape tissue boundary. Right (when grid is given): the grid cells
colored by type (interior, boundary, exterior) with the boundary outline.
Usage
plot_denmark_boundary(
  cells,
  boundary,
  grid = NULL,
  highlight = NULL,
  xlab = "x",
  ylab = "y",
  point_size = 0.15
)
Arguments
- cells
Data frame with the columns
xandy(all cells).- boundary
Polygon from
denmark_alpha_shape().- grid
Optional output of
buildgridpp(..., boundary = boundary).- highlight
Optional logical vector, one element per row of
cells:TRUEfor the cells of the analyzed type.- xlab, ylab
Axis labels.
- point_size
Size of the cell points.
Value
A ggplot object; with grid, the two panels combined with
patchwork, or a list of two ggplot objects when patchwork is not
installed.
Examples
toy <- denmark_toy_data()
tissue <- denmark_alpha_shape(toy$x, toy$y)
tumor <- subset(toy, celltype == "Tumor", select = -celltype)
g <- buildgridpp(grid_size = 10, dataset = tumor, gene = "geneA",
                 boundary = tissue)
plot_denmark_boundary(toy, tissue, grid = g,
                      highlight = toy$celltype == "Tumor")