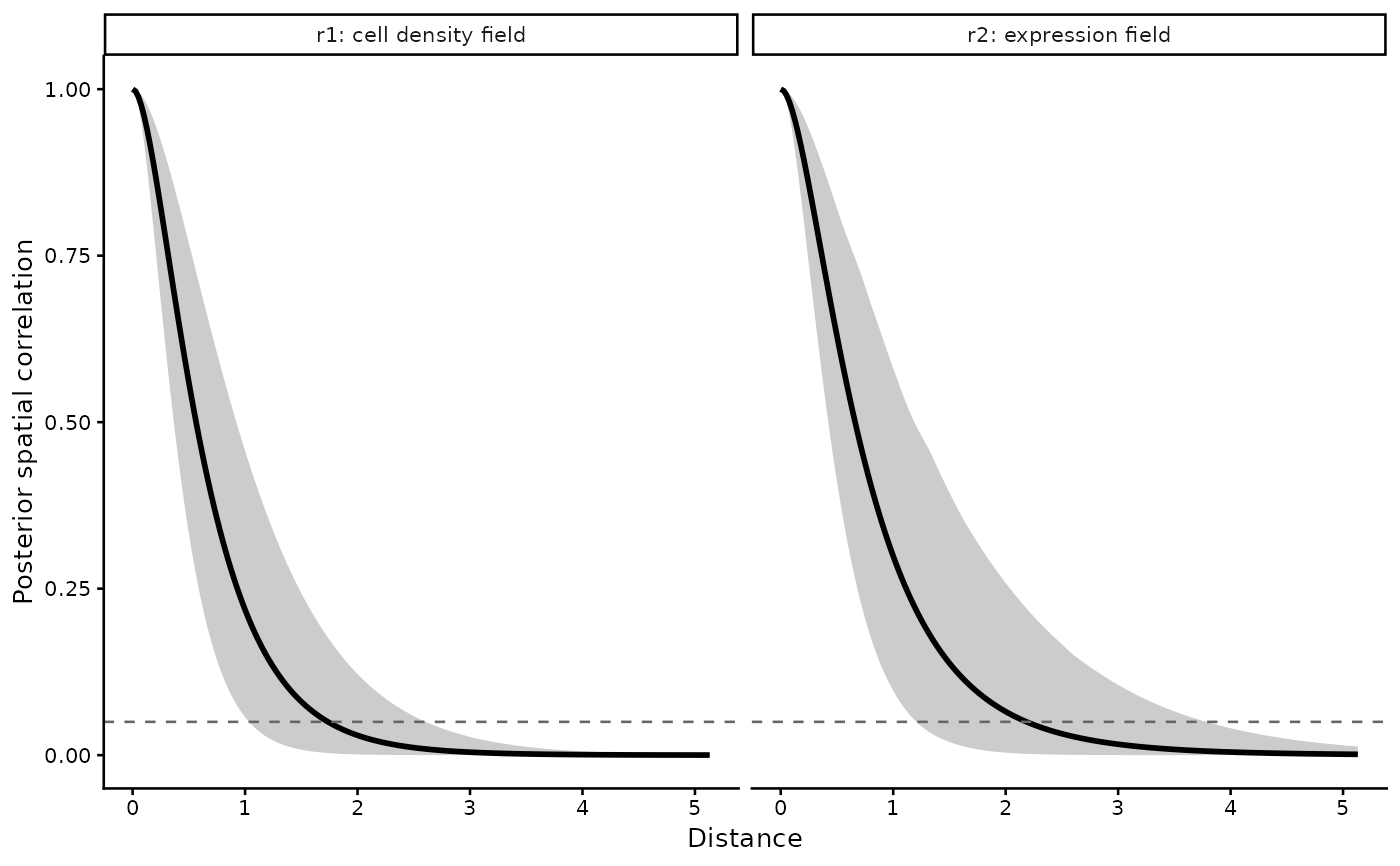
Posterior mean and band of the spatial correlation of the density and expression fields, with the threshold that defines the practical range as a dashed line.
Arguments
- obj
A
denmarkobject fromDenMark().- decay
Optional output of
denmark_decay(); computed fromobjwhenNULL.- xlab
Label of the distance axis.
Examples
toy <- denmark_toy_data()
tissue <- denmark_alpha_shape(toy$x, toy$y)
tumor <- subset(toy, celltype == "Tumor", select = -celltype)
fit <- DenMark(tumor, gene = "geneA", boundary = tissue,
               grid_size = 10, basis = 10,
               chains = 2, iter_warmup = 300, iter_sampling = 300,
               seed = 2024, quiet = TRUE)
plot_denmark_decay(fit)