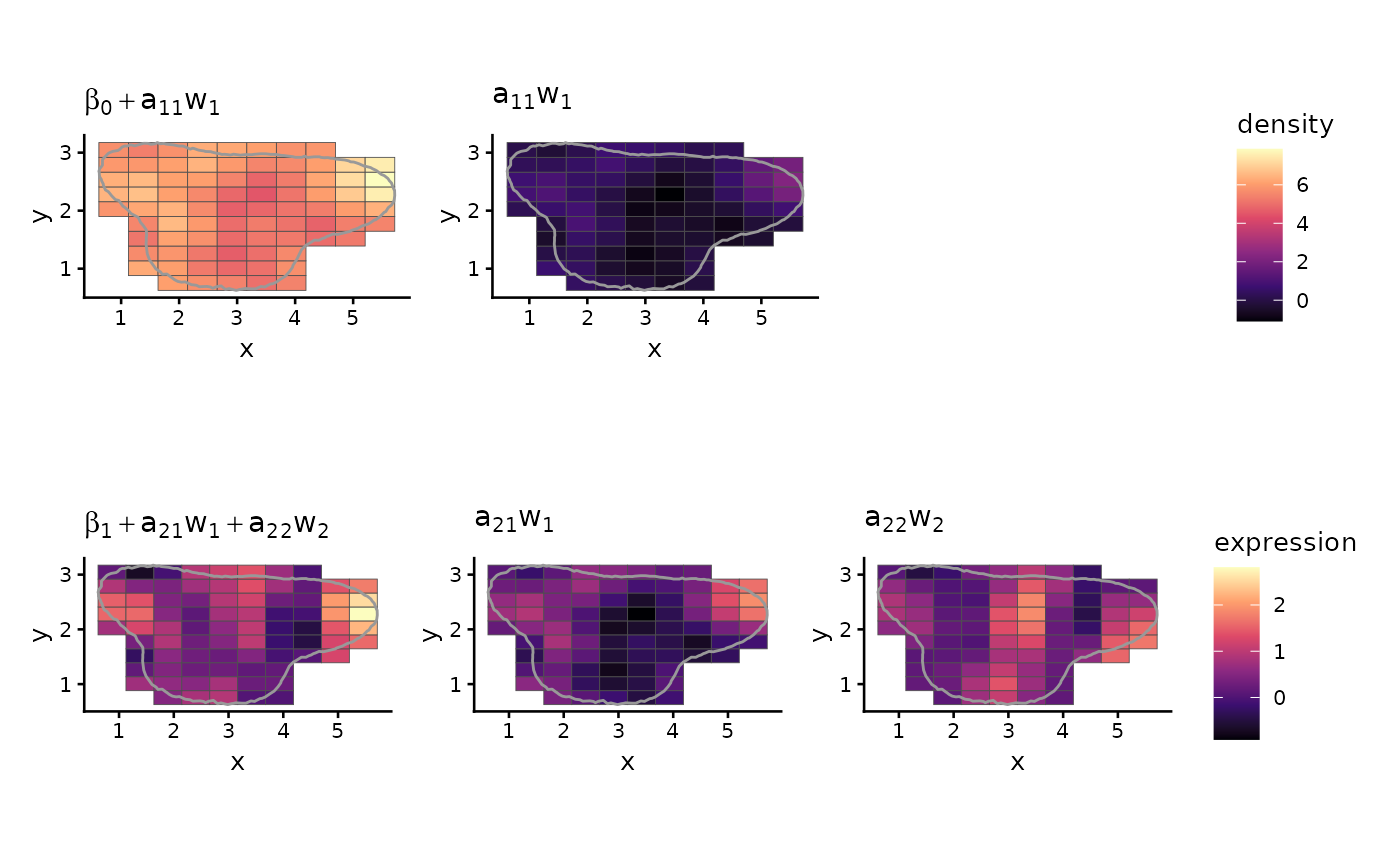
Row 1 (cell density): beta0 + a11 w1 and a11 w1, on a shared color
scale. Row 2 (expression): beta1 + a21 w1 + a22 w2, a21 w1 and
a22 w2, on a shared color scale.
Arguments
- obj
A
denmarkobject fitted withkeep_fit = TRUE.- fields
Optional output of
denmark_fields(); computed fromobjwhenNULL.- xlab, ylab
Axis labels.
Examples
toy <- denmark_toy_data()
tissue <- denmark_alpha_shape(toy$x, toy$y)
tumor <- subset(toy, celltype == "Tumor", select = -celltype)
fit <- DenMark(tumor, gene = "geneA", boundary = tissue,
               grid_size = 10, basis = 10,
               chains = 2, iter_warmup = 300, iter_sampling = 300,
               seed = 2024, quiet = TRUE)
plot_denmark_fields(fit)