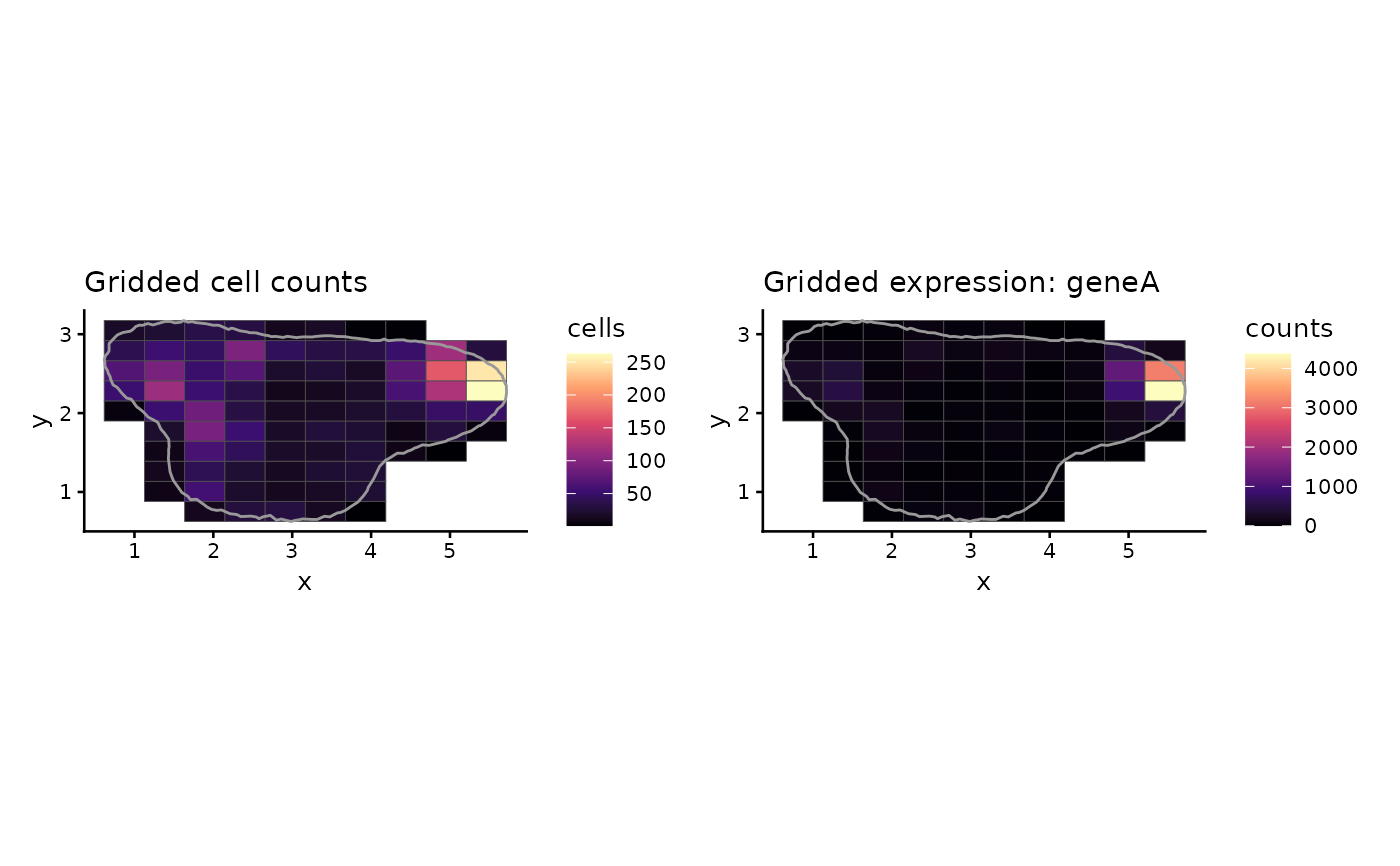
Tile maps of the cell count and the summed expression of each grid cell. With a tissue boundary, only the grid cells inside the tissue are drawn, together with the tissue outline.
Arguments
- obj
A
denmarkfit, or the result ofbuildgridpp().- xlab, ylab
Axis labels.
Value
The two panels combined with patchwork, or a list of two ggplot objects when patchwork is not installed.
Examples
toy <- denmark_toy_data()
tissue <- denmark_alpha_shape(toy$x, toy$y)
tumor <- subset(toy, celltype == "Tumor", select = -celltype)
plot_denmark_grid(buildgridpp(grid_size = 10, dataset = tumor, gene = "geneA",
                              boundary = tissue))