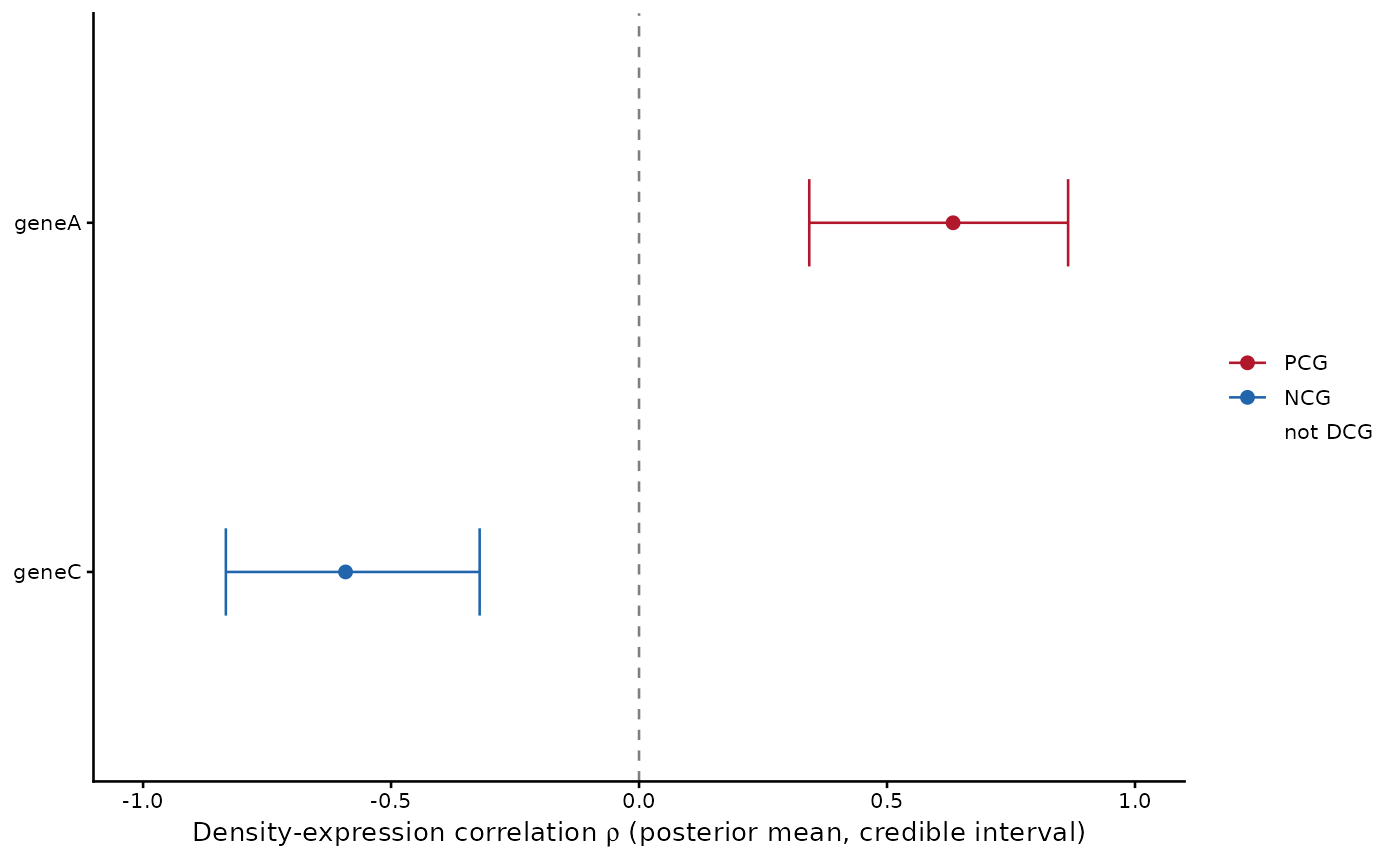
Posterior mean and credible interval of rho for each gene, colored by the DCG call.
Arguments
- scan
Data frame returned by
denmark_scan().- top
Optional number of genes to show, those with the largest absolute posterior mean of rho.
Examples
toy <- denmark_toy_data()
tissue <- denmark_alpha_shape(toy$x, toy$y)
tumor <- subset(toy, celltype == "Tumor", select = -celltype)
scan <- denmark_scan(tumor, genes = c("geneA", "geneC"), boundary = tissue,
                     grid_size = 10,
                     basis = 10, chains = 2, iter_warmup = 300,
                     iter_sampling = 300, seed = 2024, verbose = FALSE)
plot_denmark_scan(scan)
#> `height` was translated to `width`.